
[Image above] Credit: Wiley
Do you want your journal articles to stand out from the crowd?
From optimizing text for AI indexing and search engines to using Kudos and other services for informing colleagues about your published works, there are myriad methods for getting noticed.
And getting noticed is the first step toward getting cited.
One such action, providing graphical abstracts, is very simple and draws readers’ attention as they surf through journals.
What are graphical abstracts? A graphical abstract is an image, table, graph, or another figure, plus a brief text description that highlights the most important aspect of your paper. It can be from within the paper or it could be a special supplemental item. The graphical abstract appears in the journal table of contents and also when your article is highlighted (newest, most downloaded, etc.). Here is a recent example (referenced above) from the Journal of the American Ceramic Society.
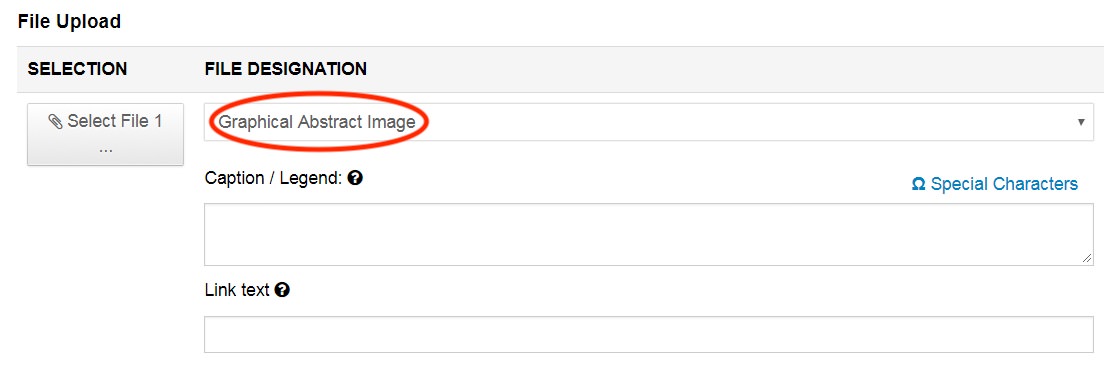
So what should you do? When you submit the final version of your article in ScholarOne, submit the file with the designation “Graphical Abstract Image.” You can add a brief caption or legend and provide a link to another resource, such as your peer-reviewed stored data. It really is that simple.
Credit: Wiley
In summary, graphical abstracts are an easy upgrade to your journal articles that will help them get noticed, downloaded, and cited.
Want to read more articles like this? Subscribe to the Ceramic Tech Today newsletter to continue to receive the latest news in the ceramic and glass industry right in your inbox! Visit this link to get started.