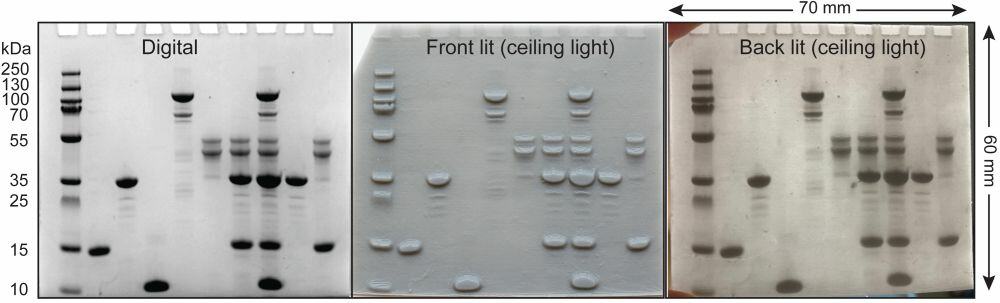
The inclusion of students with visual impairments in chemistry courses requires explicit and systematic effort. Researchers led by Baylor University explored creating lithophanes featuring data found in the chemical sciences to make scientific data accessible to everyone regardless of eyesight level.
Read More
In an effort to develop more intelligent data analysis to drive informed nanomaterials design, a unique research initiative at Lehigh University is taking the human element into account in its quest to evolve how we analyze data.
Read More