Credit: Berkely Lab; YouTube
Two recent stories illustrate how having a visual understanding of systems and processes can help researchers to explain and clarify the underlying science. The first story comes from the Lawrence Berkeley National Lab, where researchers are using advanced microscopy techniques to observe real-time growth of single nanocrystals. Led by Interim Lab Director Paul Alivisatos and Ulrich Dahmen, director of LBNL’s National Center for Electron Microscopy, a team was able to watch and record the growth of colloidal platinum nanocrystals (in solution) with a level of detail they describe as subnanometer resolution.
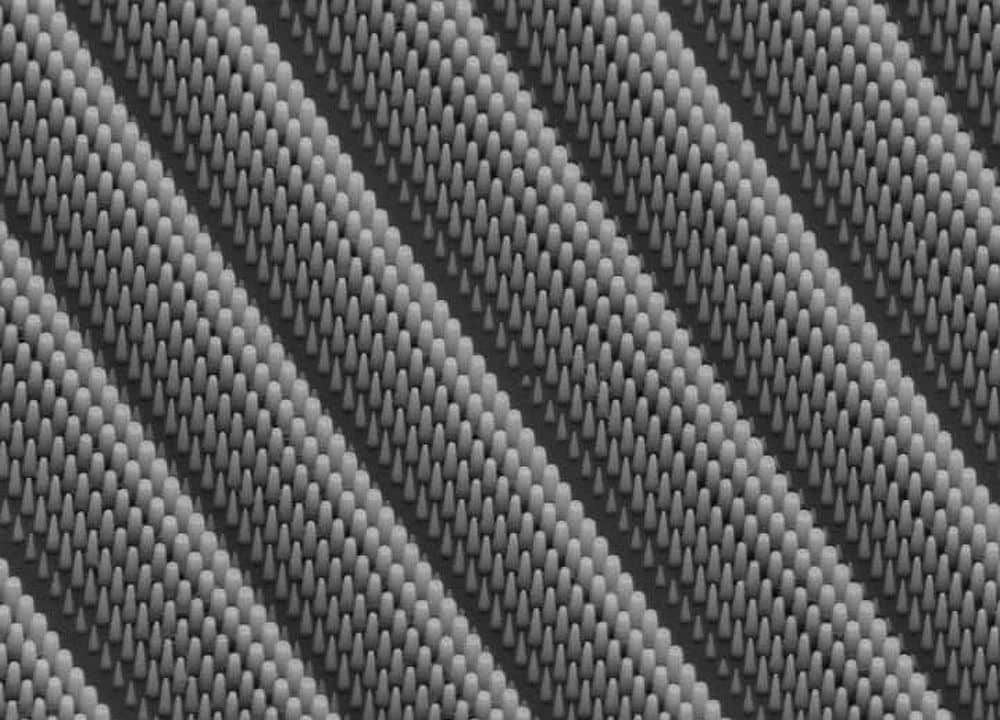
Their results showed that some crystals grow by classical nucleation and aggregation while others grow in spurts. Dubbed “coalescence events,” these spurts occur when crystals randomly collide and combine into larger crystals. Before this, the common wisdom was that coalescence events would not yield monodisperse colloidal nanocrystals, yet chemist Haimei Zheng says the results were surprising. “In our study, we found that coalescence events are frequently involved in the early stage of nanocrystal growth and yet monodisperse nanocrystals are still formed,” he said. To create the images, the team used “liquid cell in situ transmission electron microscopy” using NCEM’s JEOL 3010 In-Situ microscope. The JEOL 3010 has a spatial resolution of about 8 angstroms.

Credit: Emory University; YouTube
The second story has to do with attempts to visualize what occurs at the molecular level at the interface between crystal and liquid phases. Emory University physicist Eric Weeks asks us to imagine being a molecule at the boundary between the two phases. He asks, “So how do you know if you’re a solid or a liquid?” To get a handle on this question, Weeks’ lab decided to create a way to “see” what is occurring at the boundary. “What we’ve done is found a way to take a picture of the intrinsic interface, measure it and show how it fluctuates over time,” says Weeks. “The transition from completely organized to completely disorganized goes very quickly, spatially.” Rather than actual images, his lab uses microscopic plastic balls to model states of matter. “We used the plastic spheres to resize an experiment to a scale that we could observe. You lose some of the detail when you do this, but you hope it’s not the critical detail.” The technique is described in an Emory press release:
“[S]amples of plastic spheres were confined in wedge-shaped glass slides and loaded onto a confocal microscope turned sideways, so that gravity gradually changed the concentration gradient. Rapid, three-dimensional digital scans were made to record the Brownian motion of the particles over one hour. Algorithms were applied to the images to classify the degree of organization of each of the particles. The particles were then digitally colored: from dark blue for the most crystalline, to dark red for the most liquid. The series of images were stitched together and speeded up, becoming microscopy movies that reveal the action along the crystal/liquid interface.
The modeling product is shown in the video above. “You can watch as the boundary fluctuates,” Weeks says. “The yellow area along the bumpy line is liquid, but almost crystal. The light blue area is crystal, but almost liquid. The zone of confusion is less than two particles thick. By looking at the tiniest scale possible, we can see that the fuzzy region between the two areas is much smaller than we previously thought.”