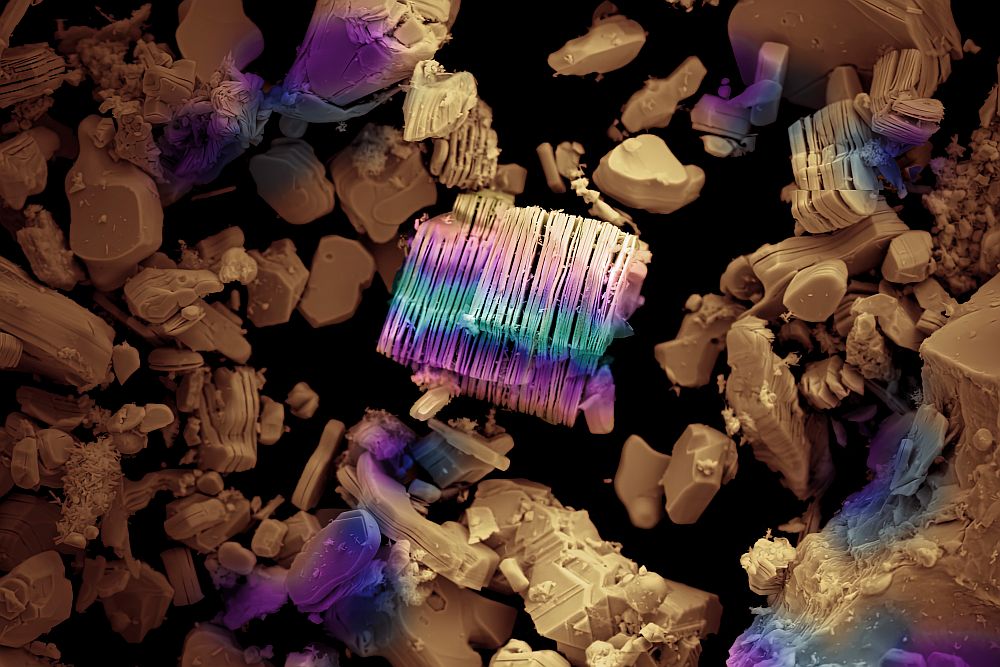
Have you ever wondered how carbon fibers were discovered? It turns out the guy who “invented” them was a sharp young physicist who knew his way around a phase diagram.
In 1958 Roger Bacon, a newly minted PhD physicist, went to work at Union Carbide’s Parma Technical Center, Parma, Ohio. (The company is now part of GrafTech International.) An article in the Cleveland Plain Dealer chronicling the discovery says Bacon was studying the melting properties of graphite under high temperature and pressure, and that he was trying to find the triple point of graphite where solid, liquid and gas are in equilibrium. The story explains what happened:
Small amounts of vaporized carbon would travel across the arc and then deposit as liquid. As Bacon decreased the pressure in the [carbon] arc, he noticed the carbon would go straight from the vapor phase to the solid phase, forming a stalagmitelike deposit on the lower electrode.
On examining them, he found they were “long filaments of perfect graphite,” about an inch long with “amazing properties.” He calculated the cost of these laboratory curiosities was about $10 million per pound. Time passed, advances were made and carbon fiber composites are now a multibillion dollar industry.
Most materials scientists know their way around a phase diagram, too. They are fundamental tools that answer the questions, “Can these elements or compounds react?” and “If so, what will they react to form?” The best and most comprehensive collection of ceramic phase diagrams is the ACerS/NIST collection, which is nearing 25,000 diagrams.
The ACerS/NIST phase diagrams partnership has nearly 70 years experience culling the best, most relevant diagrams from the peer-reviewed scientific literature. Each diagram is evaluated by experts, who provide valuable commentary on each diagram to help the investigator know the “back story” on the diagram’s data, which can be invaluable in knowing how to interpret and use the phase diagram. For example, here is a selection from the commentary provided for the SrO-Nb2O5 diagram (pictured right):
Over 30 compositions were prepared for study from starting materials “ultrapure” grade SrCO3 and Nb2O5, generally at 5 mol% intervals but more closely spaced near compounds and across the solid solution region. Specimens were synthesized by solid-state reaction in air in “Alundum” crucibles between 850° and 1,500°C in muffle or “Silit” furnaces. Atmosphere control, temperature control, accuracy, and annealing times were not stated. Phase analysis was by powder X-ray diffraction using Guinier-deWolff and FR-552 cameras and CuK-alpha radiation with germanium as internal standard. Maximum error in lattice parameter determination was <0.1%. DTA was performed using the apparatus described in Ref. 1, under He atmosphere at 100-200°C/min. The accuracy of reported temperatures is ±20°C. Of the six compounds observed, all are essentially line compounds with the marked exception of Sr6N2O11. This compound, having the cryolite structure type, has a significant solid solution region at higher temperatures, narrowing as temperature decreases. The solid solution region does not include the stoichiometric composition below 1,300°C. The ideal structure contains …
The ACerS/NIST phase diagram collection is offered in three platforms.
• Phase diagrams online – the ideal platform for institutions and organizations with multiple users.
• Phase diagrams on CD – the ideal platform for consultants and organizations with a small number of users. CD licenses are available for single users and multiple users.
• Single diagram access – the option best suited for the user with occasional, specific phase diagram needs.
To decide which is the right platform for your situation, check the expanded descriptions of these products in the FAQ page on the ACerS website or this earlier CTT post. If you purchased a CD after Oct. 1, 2011, you automatically qualify for a free update to the most recent version, Phase 3.4.
Just this summer, ACerS and NIST signed a five-year agreement to continue their partnership, which ensures the addition of about 1,000 diagrams per year to the database.
You can “test drive” the database by ordering a demonstration CD or downloading a demo CD.
Purchase of the access to the database is quite easy. Order your Single-User License or your Multiple-User License online directly from ACerS or contact Customer Service at 1-866-721-3322 or 1-614-890-4700 to order by phone.
If you or someone in your lab needs a refresher on phase diagram principles and applications, I highly recommend “Introduction to Phase Equilibria in Ceramics,” by Clifton G. Bergeron and Subhash H. Risbud. The book is concise, clear and includes many good examples of binary and ternary diagrams.
Author
Eileen De Guire
CTT Categories
- Basic Science
- Material Innovations
- Modeling & Simulation


