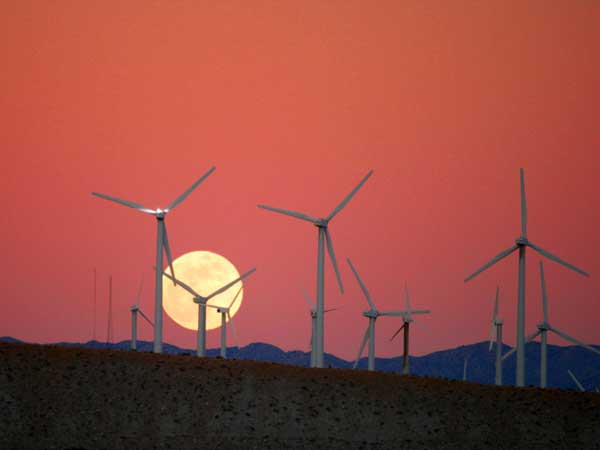
[Image above] Credit: Chuck Coker on Flickr (Creative Commons License).

The energy flow charts released by Lawrence Livermore National Laboratory show that overall energy use was up in 2013, but so too was the use of renewable and nuclear energy. Credit: Lawrence Livermore National Laboratory.
Are Americans the gas-guzzling, SUV-loving, non-renewable-resource-powering people we’ve been pegged to be?
Though we love our fossil fuels (and get 84 percent of our total energy from oil, coal, and natural gas), a new report finds that, overall, Americans used more energy in all forms—renewable, fossil, and nuclear—in 2013.
According to new data from the Lawrence Livermore National Laboratory (including the release of their annual energy flow charts), Americans used 2.3 quadrillion thermal units more in 2013 than they did in 2012.
Wind energy showed a strong 18-percent growth, and natural gas prices rose slightly— a move that not only contributed to increased carbon dioxide emissions (a first since 2010), but also demonstrates a shift from a recent reliance on the more-costly coal to cheaper-to-produce natural gas.
Nuclear energy use was also up, despite the fact that a few reactors, like the San Onofre Nuclear Generating Station in Pendleton, Calif., were shut down. (The outlook for increased nuclear production in the US is looking up, however, with the Energy Department backing a $6.5-billion loan for the construction of the nation’s first nuclear facilities in 30 years).
The majority of the energy used in 2013 was for electricity generation—some 38.2 quads—followed by transportation, industrial, residential, and commercial, all of which increased slightly.
To view the data in full, or see the flow charts (which detail not only how much energy we use, but how much we waste, also on the rise), head over here.
Author
Jessica McMathis
CTT Categories
- Energy
- Environment


