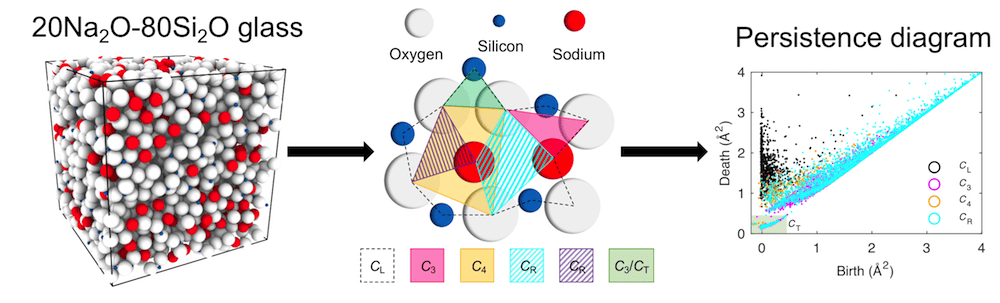
[Image above] Schematic overview of the process of obtaining a persistence diagram. Here, the trajectory information for a 20Na2O-80SiO2 glass at 300 K (oxygen: white; silicon: blue; sodium: red) is used to construct the persistence diagram. Diagram coloring represents the characteristic regions, with turquoise points representing both the turquoise and violet CR regions. Stripes indicate the region is fully or partially overlapping with another region. Credit: Sørensen et al., Science Advances (CC BY 4.0)
Even though glass is used in almost all aspects of modern life, the material itself is still a mystery in many ways.
Glass is a noncrystalline state of matter, which means its structure consists of short-range and medium-range order rather than long-range order. As such, when viewed as a whole, glass structure is disordered—which makes it difficult to accurately characterize, especially the medium-range structural order.
One way researchers look to characterize the structure of glass is by determining the structure factor. The structure factor is a mathematical description of how a material scatters incident radiation. Two different mathematical expressions are often referred to as the “structure factor,” but the more generally valid one, S(Q), is the expression used for glass.
To determine the structure factor, neutron and X-ray diffraction techniques are widely used. In these techniques, beams of neutrons or X-rays are aimed at a sample. Based on how the radiation beams are diffracted (bent) by atomic structures in the sample, a diffraction pattern is generated.
Structures containing long-range order diffract radiation beams more strongly than structures containing only short-range and medium-range order. Thus, the diffraction pattern of a crystal contains very sharp peaks whereas the diffraction pattern of glass contains peaks that look more like gentle hills.
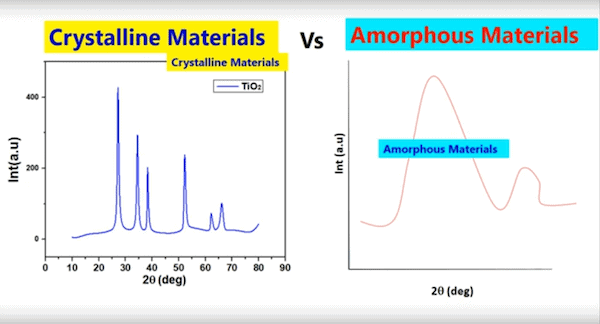
Graphs illustrating the difference between diffraction pattern of crystal, which contain sharp peaks, and amorphous materials like glass, which contain gentle peaks. Credit: MK Academy, YouTube
Once a diffraction pattern is generated and the structure factor is calculated, that information can be used to determine the atomic structure of a material. But making the connection between structure factor and atomic structure is not always easy.
The structure factor provides values in a coordinate system of frequencies called reciprocal space. These values must be mathematically translated using a Fourier transform to provide values in real space, i.e., values describing the position of atoms within the material.
Modern single crystal diffraction techniques allow for unambiguously solving the position of atoms within a crystalline structure. However, diffraction techniques for glass and other amorphous materials do not. So, people studying crystalline materials have a much easier time determining the atomic structure than people studying glass.
In the quest to understand glass structure, one diffraction peak in particular is of great interest to glass researchers—the first sharp diffraction peak (FSDP).
FSDP describes the longest separated repeating “unit” in the amorphous structure. In other words, it is a descriptor of medium-range order. Medium-range order plays an important role in control of an amorphous material’s physical properties, so determining what the FSDP describes is of more interest than investigating other peaks that instead describe short-range order.
Researchers have suggested numerous structural origins for FSDP, including quasi-crystalline and ring-type structures or layer-like and cluster-like regions. But, as explained above, determining the exact cause through experiments is difficult.
Fortunately in recent years, the growing use of simulations in research has helped deepen our understanding of the FSDP by either supporting or undermining certain models. For example, a first principles molecular dynamics simulation threw into question one void-based model proposed in 1991.
Recently, some studies have proposed another type of data analysis that may prove useful in understanding the FSDP and medium-range order more generally—persistent homology.
Persistent homology is a type of topological data analysis, meaning it focuses on analyzing the qualitative properties of a geometric object that are preserved under continuous deformations, such as stretching and bending. In other words, the “shape” of the data provides useful information about the data.
In regard to glass, researchers view persistent homology as useful because it can provide a global perspective on the system rather than being limited to analyzing specific parts of the structure, such as happens in standard ring analyses, for example.
However, previous studies that applied persistent homology to amorphous structures containing medium-range order faced some challenges.
In persistent homology, a concept called “loops” is used to understand how points of data relate to each other. (An animated graphic describing loops can be seen here.) In previous studies, researchers categorized loops using a mathematical grouping termed “optimal cycle,” but categorizing loops this way provided no direct geometrical interpretation of loops.
Finding a different way to categorize loops would likely lead to more meaningful data, and that is what researchers at Aalborg University in Denmark, along with a collaborator at the University of California, Los Angeles, looked to do.
Instead of using the “optimal cycle” approach, the researchers grouped loops into characteristic regions based on the number of atoms each loop contained. And in their open-access paper published this Wednesday, “we show that this produces meaningful data in a consistent manner (i.e., method should be transferable to different amorphous systems),” Søren S. Sørensen, first author and Ph.D. candidate at Aalborg University, says in an email.
In particular, Sørensen says based on loop sizes, they were able to define geometrical interpretations of the characteristic regions, which enabled easier structural interpretation of the glass.
The researchers were not done yet, though. Once they decided on the new method by which to group loops, they turned their attention to improving analysis of persistence diagrams (the diagrams presenting loops obtained from persistent homology analysis).
Previously, comparing persistence diagrams relied on qualitative interpretation, which made comparison difficult. So the researchers looked to compare persistence diagrams using a quantitative method: the accumulated persistence function (APF).
APF is a cumulative sum of all points in a persistence diagram weighted by the points’ lifetime. “This means that the APF characterizes the persistence diagram completely and is especially well-suited for data where ‘shortlived’ loops or voids (as found in glasses) are real structural features and not noise,” the researchers write.
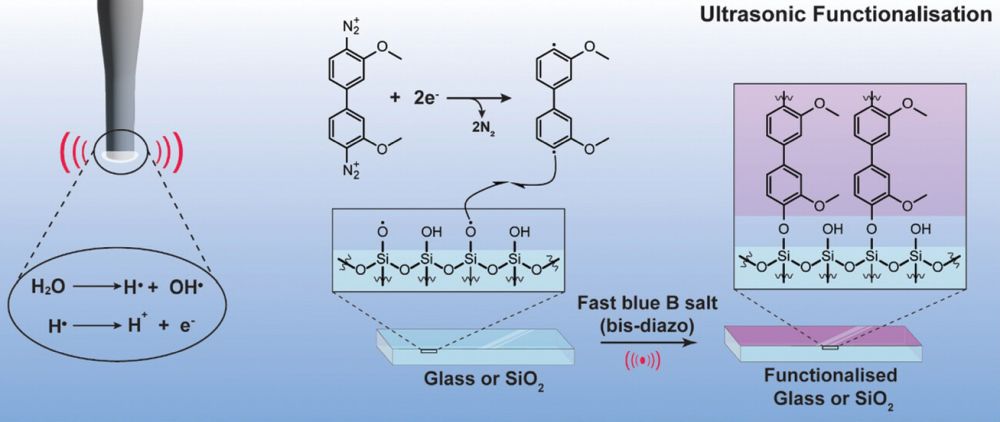
Example of how persistent homology, a topological data analysis method, can help researchers determine the structural features that contribute to the first sharp diffraction peak observed in the diffraction pattern of amorphous materials. Credit: Sørensen et al., Science Advances (CC BY 4.0)
Equipped with their new methodology for determining characteristic regions and the APF, the researchers analyzed medium-range order structure—particularly the FSDP—in sodium silicate glasses, the structures of which they generated using molecular dynamics simulations.
The researchers determined the FSDP originated from structural features of oxygen/sodium atom packing in the sodium silicate glass. Importantly, the new definitions of characteristic regions allowed the researchers to deduce how different types of loops contribute to the FSDP.
“[We] believe this approach may lead to the settlement of the long-lasting debate regarding the origin of the FSDP in glassy systems,” they write in the conclusion. “More generally, it can be applied to analyze and categorize molecular dynamics data and reveal hidden medium-range order in various amorphous materials.”
In an email, Morten Smedskjaer, senior author and professor at Aalborg University, says they plan on testing the persistent homology-based method on new glass systems and under new conditions, for example, as a function of time, pressure, or strain.
The open-access paper, published in Science Advances, is “Revealing hidden medium-range order in amorphous materials using topological data analysis” (DOI: 10.1126/sciadv.abc2320).