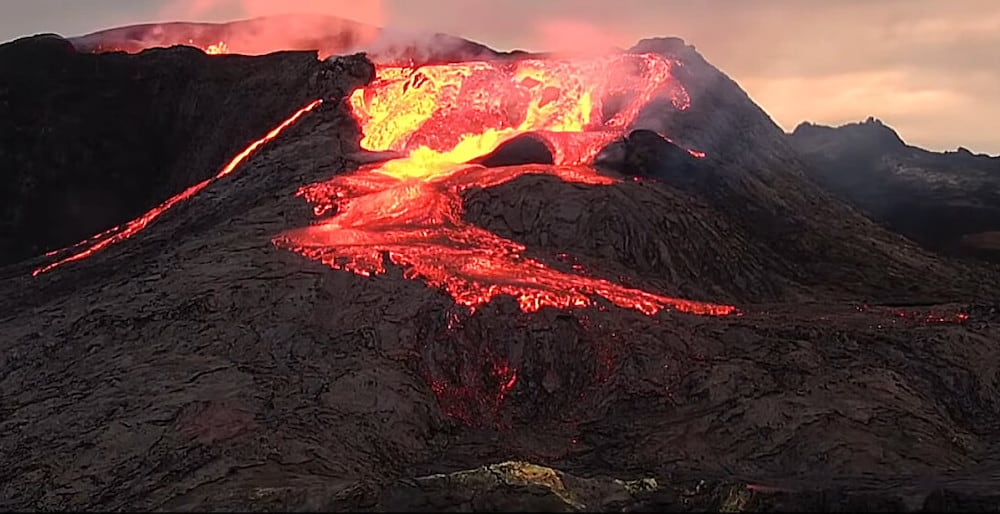
[Image above] Volcanic eruptions are a great example of a system that contains ample amounts of both thermodynamic and kinetic data. Credit: heights.18145, Flickr (CC BY-NC 2.0)
The need for new materials to address the growing demand for faster communications, better healthcare, and cleaner energy is undeniable. However, the time required to develop and deploy new materials through traditional methods is much too long.
One goal common to the Materials Genome Initiative (MGI) and global materials informatics programs is reducing this amount of time from decades to years. Learn more about the MGI by reading or listening to the interview with James Warren, director of the NIST Materials Genome Program, in the June/July 2021 ACerS Bulletin or on the Ceramic Tech Chat podcast.
One major step in speeding up materials development is rapid selection of candidate materials. Ceramic scientists and engineers have used the ACerS-NIST Phase Equilibrium Diagram database (PHASE) as one part of the materials selection process for more than 50 years. PHASE provides maps of the structural stability of ceramic material systems at the atomic level with respect to ratios of elements (composition) and temperature. And in some cases, additional factors such as pressure or environmental gas compositions are considered.
In practical terms, phase equilibrium diagrams are used to define which crystal structure or structures and liquid phases would be present at a given temperature and composition, assuming optimal processing conditions or infinite time for the material to reach the most stable condition. When more than one phase (crystal or liquid) is present, phase diagrams provide the composition of the crystal and/or liquid phases and the relative amounts of each in order to achieve the overall composition of interest.
The systems explored in phase diagrams often consist of small numbers of elements. The simplest system, called binary, contains two elements, while pseudobinary systems have two related compounds with either a single cation or anion, such as (lithium, sodium) carbonate. Ternary diagrams have three elements, while pseudoternary have three varying elements within larger systems. There are limited numbers of quarternary systems.

The phase equilibria diagram for (lithium, sodium) carbonate. Credit: Phase Equilibria Diagrams Database (NIST Standard Reference Database 31), Figure Number 1010
Critical to understanding the information in phase diagrams is the knowledge of the processes used to generate them. For the PHASE database, experts in thermodynamics critically evaluate each phase diagram and provide written commentaries that include experimental conditions and models used, along with notices of limitations to applicability and other cautions. Many diagrams are updates of previously published ones on the same system, and commentaries included with the diagrams describe the differences, which are often attributed to better data as measurement technologies improve.
The notable limitation to phase equilibrium diagrams is the requirement of equilibrium. As mentioned, achieving equilibrium requires optimal processing and/or long times. These parameters are general not achievable and certainly not practical for ceramics manufacturing. The less stable states produced by practical cooling rates will eventually shift toward the equilibrium state, though it may take thousands of years. Post-processing such as annealing can be used to stabilize ceramics by accelerating this shift. Forming beneficial precipitates is one example of such post-processing.
A second limitation is the range of systems available. One would think that the thousands of systems within the PHASE database would cover most possible combinations of elements in ceramics. However, there are many more possible combinations of elements within the periodic table than have been explored. Second, as noted above, phase diagrams show two or three (and quite rarely four) elements varying within a given system.
But materials scientists want to explore new systems and those with more elements, including new glasses and doping materials to enhance properties. In these cases, they will consult and compare multiple phase diagrams to approximate what might happen. This approach, however, does not always provide sufficient insights to the critical questions surrounding materials selection.
The use of modeling to fill in gaps and expand the ranges of property predictions has gained in popularity. Among the many types of models is the CALPHAD methodology, which is computerized coupling of phase diagrams and thermochemistry. Tessa Davey, assistant professor at Tohoku University, described the CALPHAD method in her Ceramics Tech Chat interview. She explains, “So, experimental and theoretical data relating to phase diagram calculations, thermodynamics, crystallography, mechanical properties, sort of everything. And it ties it together into a single model.” She goes on to explain how she uses it as part of her suite of tools to explore high-temperature materials where experiments are expensive, difficult, and rife with pitfalls such as impurities.
A recent webinar sponsored by the Materials Research Society and Thermo-Calc, a vendor of software for the CALPHAD method, provides further insights into the use of CALPHAD in conjunction with experiments and phase equilibrium diagrams. While the target materials are high-entropy metal alloys, there is plenty of information salient to ceramic scientists.
The webinar speaker, ACerS member Paul Mason, provided statistics that showed 68% of the people surveyed consult a handbook or internet data on close-lying materials. He also showed that minor variations of composition with multielement alloys can create tens of thousands of potential compositions.
The CALPHAD method also can be used to model kinetic phenomena, such as diffusion mobility, and therefore provides insights into the changes occurring during materials processing. This data complements equilibrium thermodynamics information of phase diagrams.

CALPHAD model of temperature distribution and thermal lag in a pyrometric cone as functions of distance from the cone base to the cone. Credit: Peter Hsieh, International Journal of Ceramic Engineering & Science (CC BY 4.0)
You may be wondering if having CALPHAD can serve all the needs of a lab. Phase diagrams provide one view of a prospective material in a very quick fashion, while CALPHAD provides others. But as both Davey and Mason stated, CALPHAD and PHASE are tools to help guide the ultimate goal of experimenting on materials to meet application-specific needs.
Author
Jonathon Foreman
CTT Categories
- Education
- Modeling & Simulation


