
[Image above] Determining viscosity of a glass through experiment is a slow and expensive process. A simple model, combined with dilatometry and DSC, could speed up the process immensely. Credit: Pikist
I imagine you are familiar with glasses. They are noncrystalline solids without any long-range atomic order, making them more structurally similar to liquids than to crystalline solids.
When it comes to analyzing and categorizing glasses, the most common/notable properties and their measurement techniques are
- Viscosity, measured by several methods;
- Thermal expansion, measured with a dilatometer/thermomechanical analyzer; and
- Heat capacity, measured with a differential scanning calorimeter (DSC).
Viscosity, the resistance to flow, is readily understood. High viscosity liquids such as molasses or honey require high forces to get them to flow. Water, alcohol, and other low viscosity liquids flow more readily.
Glasses are differentiated from liquids by viscosity, with a material becoming glassy when viscosity exceeds 1012 Pa-S. And for glasses, how viscosity changes with different temperatures is extremely important.
Unfortunately, viscosity is difficult to measure over wide temperature ranges, requiring multiple measuring devices that use relatively large samples that must be fabricated to specific shapes with relatively tight tolerances. Viscosity–temperature profile measurements are therefore expensive and slow and should be reserved for only the most promising candidate glasses.
Fortunately, the atomic-level processes that control viscosity also control thermal expansion and heat capacity. Thus, in theory, one could use either or both of these properties to predict the viscosity of glasses at different temperatures. And that is exactly what two recent papers written by researchers led by John Mauro, professor at The Pennsylvania State University and editor of Journal of the American Ceramic Society (JACerS), demonstrate.
MYEGA model: A “new” model for describing viscosity
In 2009, Mauro—who was then a researcher at Corning—and his colleagues published a paper in Proceedings of the National Academy of Sciences that proposed a new model for determining viscosity of glass-forming liquids. Named the Mauro–Yue–Ellison–Gupta–Allan (MYEGA) model, this model relates viscosity at a given temperature [η(T)] to three factors: the glass transition temperature (Tg), the fragility index (m), and the high-temperature viscosity limit (η∞).
The glass transition refers to the temperature range in which a glass transitions from being in a solid state to entering a viscous state. It is not actually a thermodynamic transition; rather, it is kinetic and depends on thermal history, both prior-to and during the measurements. Some glass transitions are rather sharp, occurring within a small temperature window, while others are more diffuse, occurring over a broader temperature window. Therefore, determining the glass transition temperature Tg can be tricky, and values should include information about how Tg is measured.
“Fragility” is a measure of the kinetic processes in glasses, which lead to and are measured by the breadth of the glass transition. “Fragile” glasses have high fragility index (m) values and sharp glass transitions; “strong” glasses have broader transitions and low m values.
How does fragility affect glass processing? The broader the glass transition, the more slowly the properties change—most notably viscosity. So strong glasses, which retain high viscosities over broader temperature ranges, can be worked with for longer periods than fragile glasses, which become too fluid to work with at temperatures only moderately higher than Tg.
Compared to glass transition and fragility, the definition of high-temperature viscosity limit (η∞) is straightforward—it is the minimum viscosity a material can possibly reach even if temperature rose continually to infinity.
Applying MYEGA: Determining Tg and m using DSC and dilatometry
For silicate glass-forming liquids, η∞ was shown to be constant at 10-2.93 Pa·s, which is a slightly higher value than the viscosity of water at 20°C. As such, only Tg and m need to be measured and calculated for the entire viscosity curve to be determined for such systems.
In the two recent papers by Mauro and his colleagues, they decided to use dilatometry and DSC to calculate Tg.
Both dilatometry and DSC are already routinely used to determine Tg. (Technically, these techniques measure fictive temperature (Tf), a value that describes the temperature at the onset of the glass transition.) In the two papers, Tg was defined from the fictive temperature determined at a heating rate of 10 K/min.
To calculate m, the fictive temperature is measured at multiple heating rates, typically from 1 to 30 K/min. Strong glasses have a wide range of fictive temperatures, while fragile glasses exhibit closely grouped Tf values. The two papers describe the specific calculations used for determining the m values for the different glass samples.
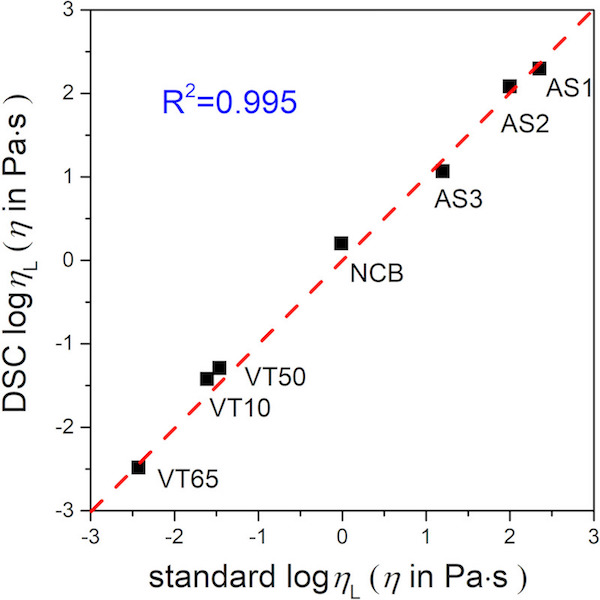
Ultimately, the researchers showed that values of Tg and m calculated using dilatometry and DSC matched closely with the values determined through viscosity experiments. Furthermore, the viscosity values calculated from the MYEGA model using the dilatometry and DSC data are in reasonable agreement with directly measured values. The correlation for DSC predictions is shown below.
The effects of these findings are substantial. Dilatometry and DSC experiments take only a few hours to a few days to attain the full viscosity profiles, in contrast to traditional methods which can take much longer.
Furthermore, sampling for these techniques is substantially easier, with relatively small bars for dilatometry and only a few mg of sample needed for DSC. Not to mention that extra information can be found using these methods, including the liquidus temperature from DSC, which can be used to estimate viscosity at the liquidus temperature, i.e., the minimum temperature needed to prevent the formation of crystals during processing.
In summary, the viscosity-temperature predictions from the MYEGA model using dilatometry or DSC data were shown to compare well to measured viscosity-temperature profiles for glasses over a wide range of fragilities. Using these tools can save substantial time and expense for downselecting candidate glasses for direct viscosity measurements.
Most, if not all, glass research labs already have dilatometers and calorimeters. Imagine your boss’s reaction when you demonstrate the value you add to your research group by using the techniques described in these articles!
The first paper, published in Journal of the American Ceramic Society, is “Dilatometric fragility and prediction of the viscosity curve of glass‐forming liquids” (DOI: 10.1111/jace.17125).
The second paper, published in Journal of the American Ceramic Society, is “Determining the liquidus viscosity of glass-forming liquids through differential scanning calorimetry” (DOI: 10.1111/jace.17363).